4. Metrics engine and probability analysis
How the arena turned every replay into per-round metrics and a P(A wins) curve, how well that curve predicted real games, and what it taught us about the top teams.
A dragons game lasts 500 rounds, and a win-loss line throws almost all of it away. By early October our verdicts were 78-game draft runs in the arena, and 78 games is about ±9 wins: a 41-37 result told us nothing. On 10-02 we added a metrics engine to tokenz-arena (arena/metrics/) and an eval bar on top of it. We wanted agents to see how a bot did in the early, mid and end game, not only whether it won: we think the game splits into those phases and that each of them matters. Our own notes later recommended the eval as “a lower-variance signal” than W-L, and that is how it ended up being used: to read a game before it ended, and to find the round where it turned.
From replay to numbers
Every game the arena played left a .replay file. The metrics code decodes it and replays the game round by round in state.py. Every 10 rounds, and at the last round, it calls every registered metric once per team with the board state and cached helpers (BFS distances from each team’s heads, running counters for pearls, deaths, kills and splits).
A metric is a decorated Python function in arena/metrics/plugins/; dropping a new file in that folder registers it. The one that mattered most was board_control: the share of all tiles that this team’s heads reach before the enemy’s (BFS, bodies ignored). The rest were counts (dragons, log_dragons = log(1 + dragons alive), total_length, longest, pearls_eaten, deaths, kills, splits), the queen (queen_alive, queen_length, plus queen_room, queen_danger and queen_share for how a bot handles her) and exploration (tiles_visited, tiles_seen).
The output is one small JSON per game: each metric’s series for both teams, plus how and when each queen died. Changing a metric means bumping its version; a background task then recomputes older games.
Python stayed the reference. On 10-03 we added native/metrics, a C++ twin of every plugin, about 50x faster (20-30 ms a game on one core). The arena uses the binary only when it has every registered metric at the same version, and a parity script must report every replay identical; a new metric runs in Python until someone ports it.
The eval: P(A wins)
The eval is a derived metric: it takes the per-team values at a round and returns the chance that team A wins. It is a logistic model on five differences:
z(r) = w1(r)·Δlog(1+dragons) + w2(r)·Δboard_control + w3(r)·Δlongest
     + w4(r)·Δqueen_alive   + w5(r)·leader

P(A wins at round r) = 1 / (1 + e^(-z(r)))
Each Δ is A minus B. leader is +1 or -1 for whoever would win if the game ended now under the round-500 rule (queen length, then longest dragon, then total length), 0 if tied. The weights are fitted separately at 12 knots (rounds 10, 20, 50, 100, then every 50 to 450, and 490) and interpolated linearly in between. If a team has no dragons left the answer is 1 or 0, and at round 500 it is the result, not a prediction.
The fitted weights tell the story of a game:
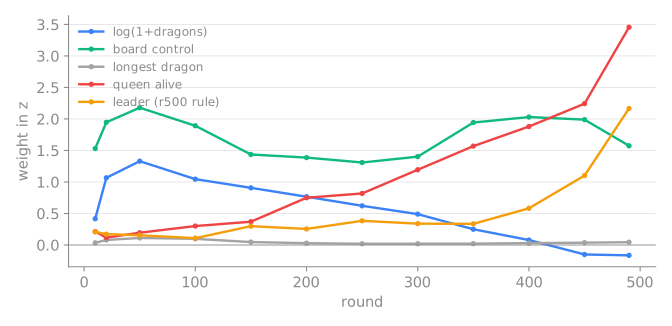
Early on, numbers and space are what count. The queen’s weight grows from almost nothing to the largest term by the end, and the count of dragons stops mattering at all.
The inputs came from an analysis of about 8,500 arena games and 258 real competition games (docs/METRICS.md): board control and log dragons predicted best from round 50 to 350 (AUC 0.80-0.84 on real games), the longest dragon decided round 500 in about 95% of games that got there, and kills predicted nothing on their own. Deaths even went slightly with winning: bots that split and expand lose more dragons. The finer queen metrics added nothing on top of whether she was alive.
Version 1 was fitted on arena games only. Version 2 (fitted 2026-10-02 04:40Z) used 1,141 games between the competition’s top teams, 435 of our server games and 3,980 arena games, each set weighted equally. Our bots didn’t play as well as the top players, so a model fitted on our own games had to be refitted against real ones. The top-team games played differently: round 500 was decided by the queen in 25% of them, against about 4% in our arena and server games. With them in the fit, v2 gives the queen about twice v1’s weight from round 200 on.
How well it predicted
Out of fold, on top-team games, v2 called the winner 70% of the time at round 100, 75% at r300, 81% at r400 and 96% at r490. Version 1 had managed 70, 68, 74 and 89%. On our own server games v2 got 72, 76, 77 and 95%.
Workers reported the mean eval against their parent at r100, r200 and r300 next to their W-D-L, and analysts used the curves to find where losses turned: a loss whose eval stays below 0.5 from round 60 is a different problem from one that sits at 0.8 until a queen dies at round 410.
The evals service
arena evals, a separate process, kept checking it against games it hadn’t seen: finished battles between other teams on the competition server. Every 5 minutes it read the leaderboard, took the last six battles of each of the top 40 teams, downloaded any it hadn’t seen and computed their metrics. A fitted metric carries the timestamp of the newest game its fit saw, and the /evals page judges it only on later games.
The page showed accuracy, AUC, log loss and Brier per round against a baseline (whoever leads under the round-500 rule right now), calibration plots, and accuracy over 5-hour to all-time windows, so a change in how the top teams played would show in the short windows first. By the time the arena stopped, the snapshot held 64,090 eval games from 10,947 server battles.
What it taught us
The biggest lesson came from evals-r13 on 10-05: an analyst took 2,382 eval games from 342 battles involving a top-10 team, plus 214 decoded replays, and compared them with 211 server games of our then-head ring-plus-9.
The top teams did not guard their queen better. Theirs died in 66% of games, ours in 36%. But they won 53% of the games in which their queen died, and we won 23%. What they had was army: at round 300 their total length was 120 to our 81, their board control 0.60 to our 0.51, and their longest dragon 12.7 to our 5.1. We lost 171 dragons to self-inflicted deaths before r300 against their 113, mostly 2-long split children boxed in by our own bodies.
A server analysis the same day (server-r13, 156 losses) agreed from the other side. In 69 of 75 losses where our queen died head-on, P(win) was already below 0.35 before she died. More queen safety was worth at most about 5 games: the queen deaths were a symptom of a game already lost.
The deep analysis of 10-07 (docs/analysis-2026-10-07) used the eval to assign each of 287 server losses one primary cause. 150 of them (52%) were lost in the opening: the eval stayed below 0.5 from round 60 or earlier. Board control at round 60 between 0.2 and 0.3 won 32% of the time; between 0.7 and 0.8, 90%. The same report found our queen died in 207 of 288 losses, 64 of them thrown wins where the enemy queen had died first. Both readings are true; the eval let us say which came first.
Metrics are not goals
On 10-05 we reminded the orchestrator of Goodhart’s law: a metric must not become the goal. A change can move the number named in its brief without fixing the behaviour.
We had examples on file. evals-r13 said we lost far more split children to our own bodies, so on 10-05 two workers cut splits: ring-churn-1 refused growth splits in crowds and went 38-41; ring-longmid-1 split only at longer lengths and went 25-42. Both shrank the army. The short-lived children were paying for themselves by taking pearls and space first. The churn number was real; treating it as the target was the mistake. ring-sprint-1 (10-06) closed a gap the analyses had measured, raising free multi-step moves from 2.5% to 33% of eligible moves, and its measured server performance didn’t move: its long dragons were killed more often, and the longest at r400 was unchanged. And on 10-06 the orchestrator held back ring-qforage-1 because its early queen death rate had doubled, while it was winning. We corrected that too: the queen’s survival is evidence to weigh, never a cap by itself.
What changed in practice:
- Briefs named the target behaviour seen in replays; metrics were evidence for it.
- Workers checked decoded replays of their own draft in the targeted situation, before and after, and named the game ids. “A metric moved but the replays don’t show the intended behaviour” counted as a failure.
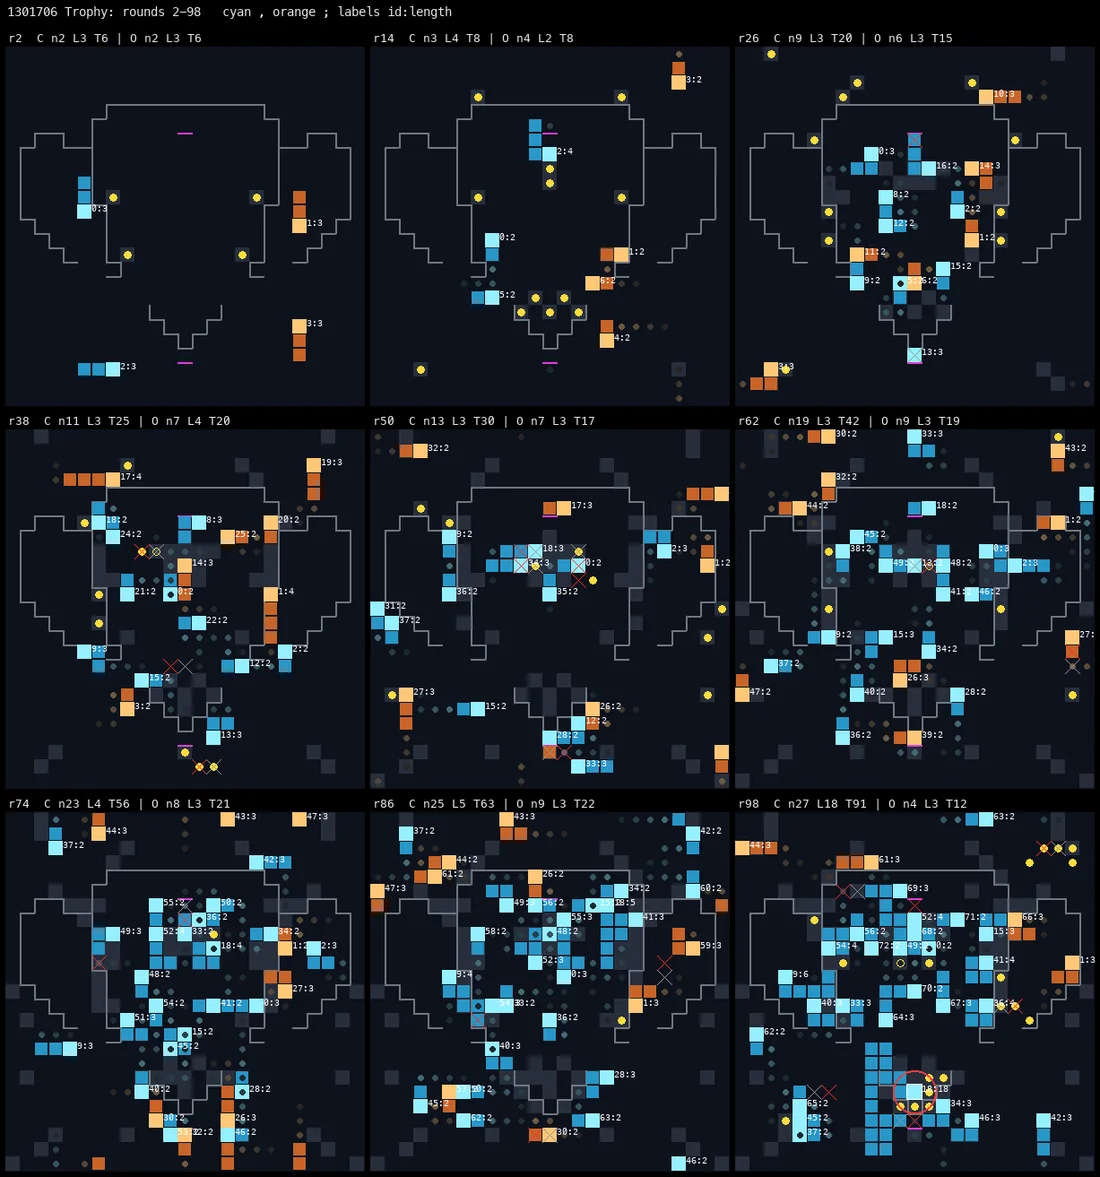
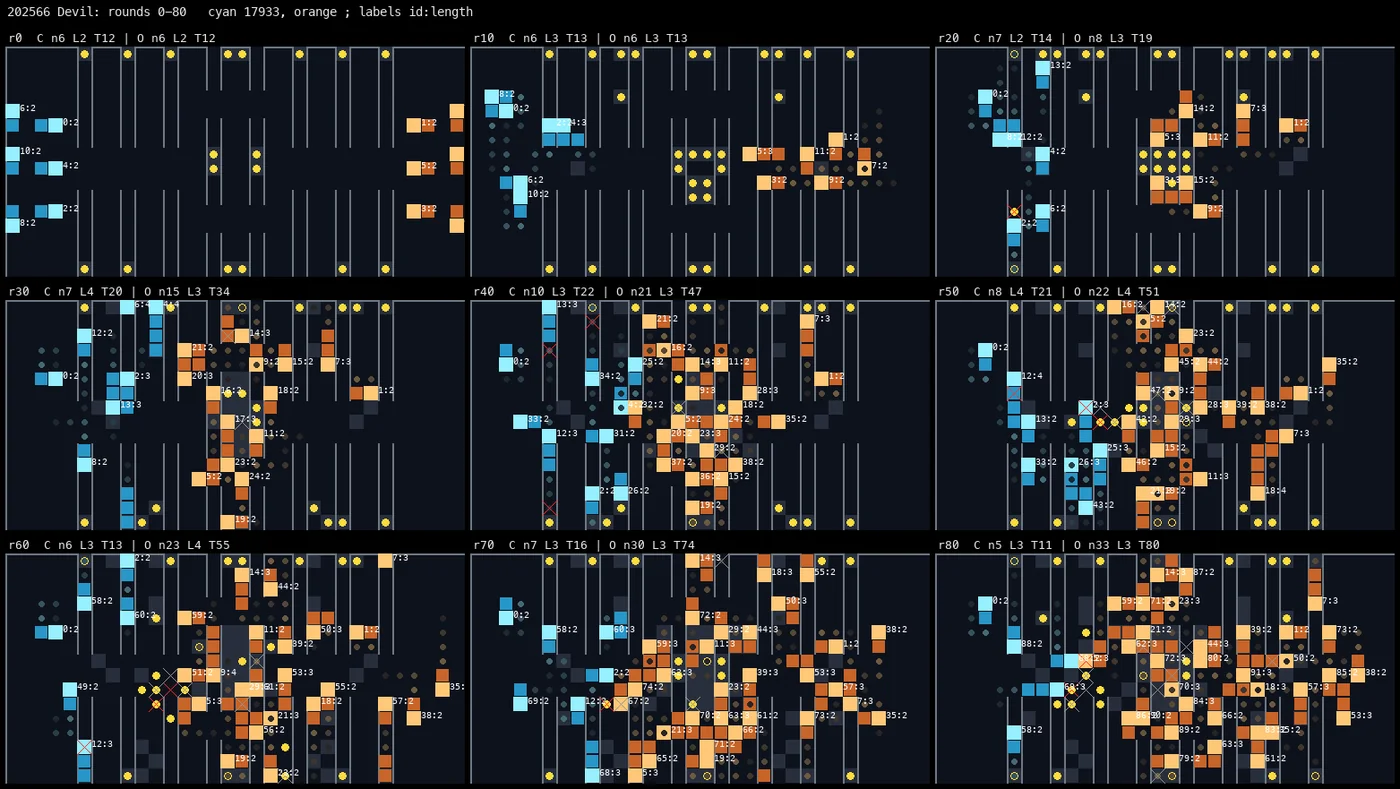
- Before a promotion, an analyst rendered the draft’s games as filmstrips and looked at them. Images earned their place: one Colosseum filmstrip showed our lone queen at length 7 among pearls, contradicting a worker’s numbers-based story that she sat at length 2 with no pearls.
The eval stayed on every game page until the end. It just stopped being the thing we tried to raise.